• pic1
  • pic2
  • pic3
Ship Management
Chartering
Oil tankers chartering
Technical Management
Ferrying of Vessels
Ship repair and modernization
Sale and Purchase of Vessels
Survey Services
Thickness measurements
Diesel Diagnosis (DDS)
ISM, ISPS, MLC, BWM

Diesel Diagnosis Systems (DDS)

Back to "Diesel Diagnosis Systems (DDS)"

Monitoring Modes

1. Engine Protection (Background) Mode

  • Engine Protection (Background) mode starts running immediately after the measurement system is turned on. 
  • This mode is used for Live Continuous Monitoring of the combustion process inside each cylinder, and except when analysis is being done at the home office, can NOT be turned off.
  • The Engine Protection Area of the screen continuously displays bar graphs of RPM, Power and Maximum Pressure.
  • All cylinders and the entire engine are under overload protection.  Any Main Engine Alerts that are generated will overwrite all other messages in the Warning Area of the screen.
  • Measured data will automatically be stored in the database for future analysis.

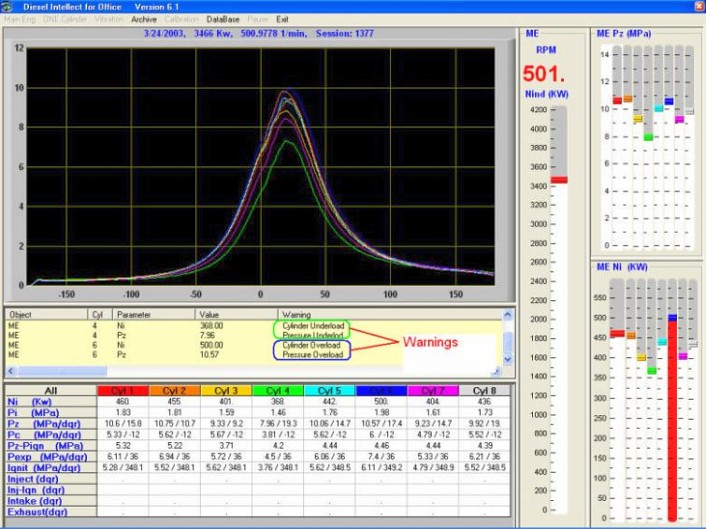
2. Main Engine Mode

Figure 6.1

  • Main Engine mode will display the results of all Main Engine cylinder measurements in the Graph, Warning and Parameter Grid Areas.
  • This is the Default Mode.  The system will automatically return to this mode after a pre-set (by the home-office) period of time. 
  • If the monitoring system includes Stationary Vibration Sensors, the Fuel Injection Timing Parameters will also be displayed in the Parameter Grid Area, per each cylinder of the main engine.

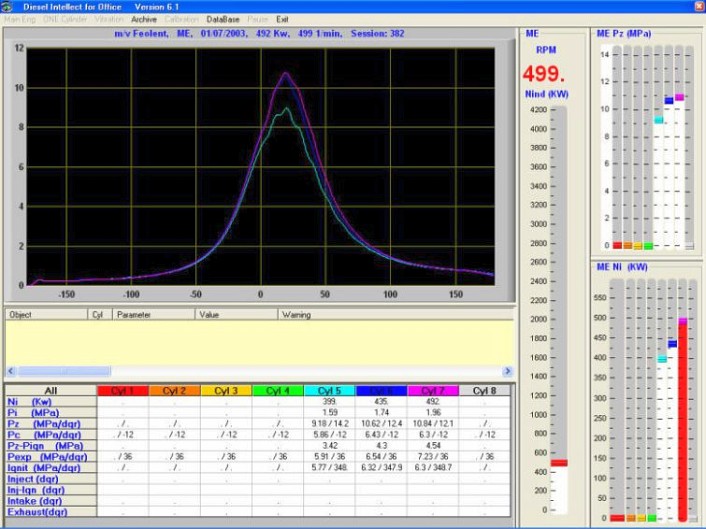
3. One Cylinder Mode 

Figure 6.2

  • One Cylinder mode is used for detailed diagnostics of a particular cylinder of the Main Engine, or for measurement of Auxiliary Engines.
  • The user selects which engine and cylinder are to be examined.
  • If the monitoring system includes Stationary Vibration Sensors, the Fuel Injection Timing Parameters will also be displayed in the Parameter Grid Area, for the selected cylinder.
  • Alerts for all cylinders, including the one under examination, continue to be generated as usual, and are displayed in the Warning Area.
  • The system will wait until measurements of all cylinders have been taken, and then will present Advice (in the Warning Area) for Engine Tuning.
  • After measurements of the selected (or all) cylinders have been completed, they can be saved to the Database by clicking Save from the One Cylinder menu.
.

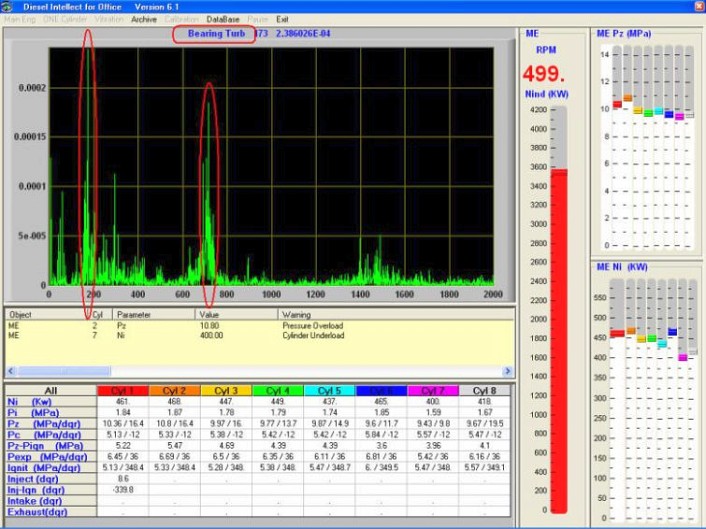
4. Vibration

Figure 6.3

  • Vibration mode is used for diagnosing auxiliary equipment (objects) such as gears, pumps and compressors. 
  • The user can select an existing object or set up a new one by answering a few system questions. Depending on the request, the user selects either New Object or Select Object from the Vibration menu.
  • After the object is selected, measurement will be started automatically, and the power spectrum will be presented in the Graph Area of the screen.  The user can save the measurement to the Database by clicking Save in the Vibration menu.  Stored data can be used for comparison with the previous measurement of the same selected object.

5. Archive Mode

  • Archive mode is used to analyze previously saved data.
  • It operates in two ways: over a span of time (Track) or at a specific instant (Measurement).
  • By selecting Measurement from the Archive menu, a user can search a single measurement by specifying:
  • Location (vessel, power plant, locomotive facility, etc)
  • Object (engine, pump, gear, etc)
  • Range (date, power, pressure, etc)
  • Events (warnings, alerts)
  • The stored result will be presented, on the screen, exactly as it appeared at the time of the original measurement. ( Figure 6.1)

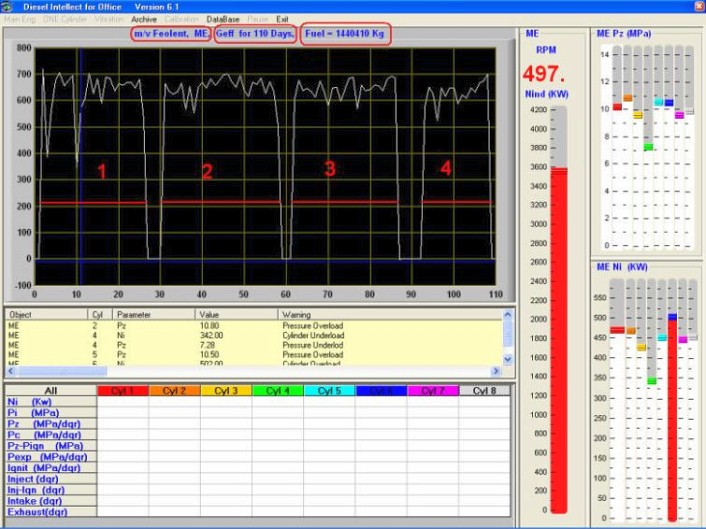
6. Track Mode  

Figure 6.4

  • By selecting Track from the Archive menu, the user will be able to see the selected parameter’s changes over time. The time period can be specified by:
  • period (hour, day, week, month and year)
  • number of periods
  • finish date (today, two months ago, etc.)
  • The default parameter for the time Track presentation is Hourly Fuel Consumption, for the selected object. The total fuel consumption, for the selected time period, will be displayed at the top of the Graph Area. ( Figure 6.4 )
  • The Parameter Grid Area can be used as a menu for the cylinder and parameter to be shown in the Graph Area.  It is also used to return to Track mode after going to Measurement mode.
  • By clicking at any particular moment of the parameter’s time Track, the user will be able to switch the data presentation from time Track mode to single Measurement mode at the selected instant (Figure 6.1).
  • Track mode is generally used by home-office engineers for analysis of condition changes in either the engine or auxiliary equipment.

7. Calibration

  • Calibration mode is used during system setup and for periodic validation of sensors.

8. Database

  • Database mode is used for saving data that is to be reported to the home-office.
  • The DII monitoring system is capable of sending the data to remote offices for home-office engineering analysis.
  • When used on the DII home-office computer, the same Database menu will read the previously saved data.