 |  |
phone: +7 495 1087345 fax: +7 495 1087345 office@trans-service.org |
 |  |  |
 |
 |

Diesel Diagnosis Systems (DDS)
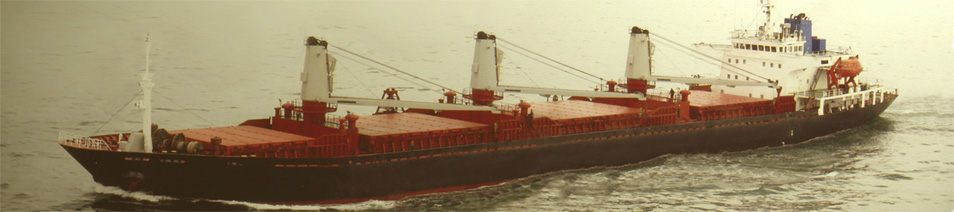
Overview:
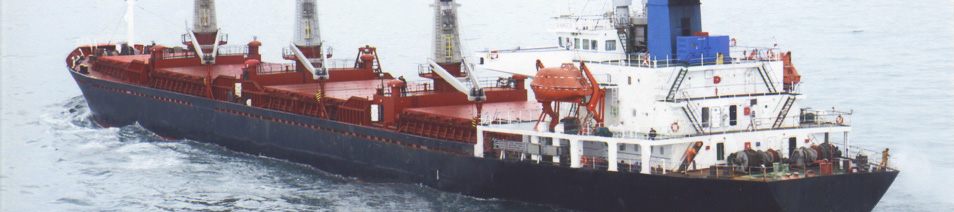
Monitoring System Hardware:
System Use:
Back to "Diesel Diagnosis Systems (DDS)"
Home Office Analysis
The Home Office Analysis function uses the Archive mode. It can be activated in the field or at the office. If in the field, Main Engine monitoring and protection continues to be done and can NOT be turned off.
Analysis is done using the archived data. It operates in two ways: over a span of time (Track) or at a specific instant (Measurement). The default parameter for the Track presentation is Main Engine Hourly Fuel Consumption, for the selected object. Parameter Track data is restricted from general access, and is available to users based on individually granted permissions.
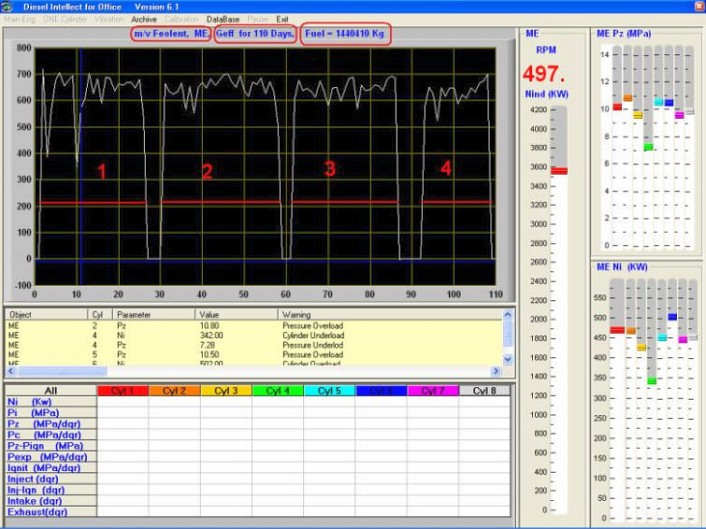
In this example, the Main Engine Fuel Consumption of the last 110 days is shown.
Total Main Engine Fuel Consumption is shown at the top as 1,440,410 kilograms.
The Graph Area indicates that the ship made four trips during this period.
Analysis time frames can be selected by hours, days, weeks, months and years. The current slide is a detailed view of a 50-hour time frame.

Notice that the Fuel Consumption quantity was changed to reflect the 50-hour period. There was an emergency slow-down at the end of day one (red circle). It might necessitate querying the logs or personnel who were on-watch at the time of the occurrence.
When in the ‘Parameter Track’ mode, the lower portion of the screen can be used as a menu for graphic display. By clicking on the Power, without specifying the cylinder (red star), the Engine Power is displayed.
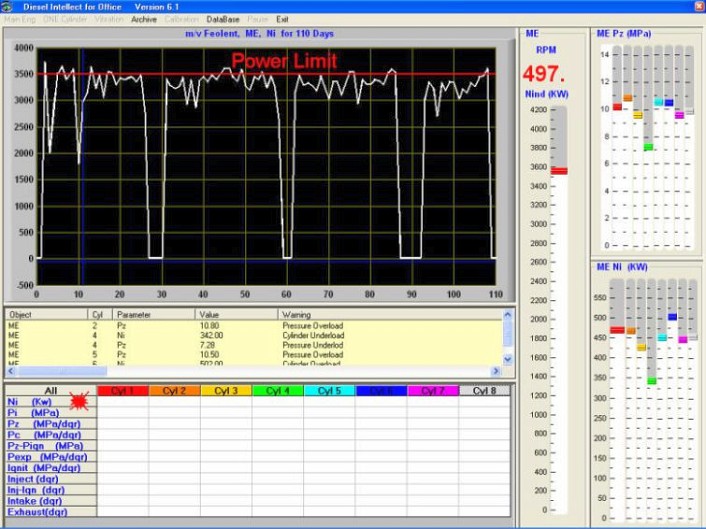
If a limit was specified for the selected parameter, the limit will appear as a red line. The graph allows the determination of the time and duration of any Engine Overload.
While in the Track mode, and continuing to use the lower portion of the screen as a menu, clicking on a selected cell (red star) will display the corresponding Parameter (based on the cell-Row) for the selected Cylinder (based on the cell-Column).
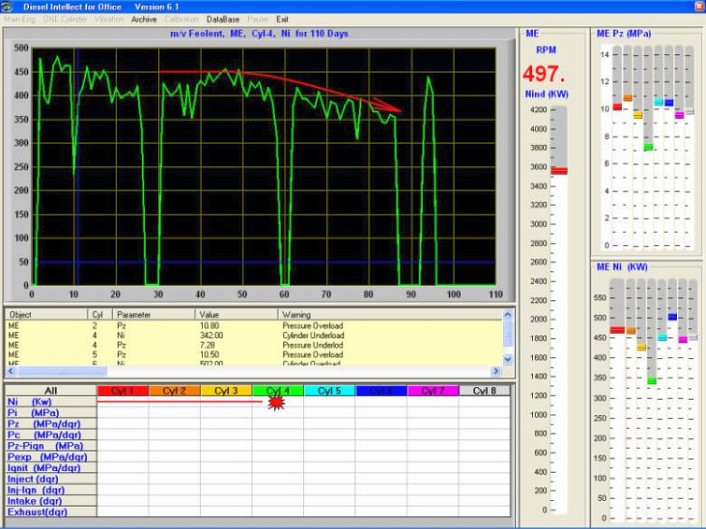
In the current example, cylinder 4 shows a dramatic loss of power during the third voyage.
By analyzing each of the parameters of cylinder 4, you can determine the cause of the power loss.
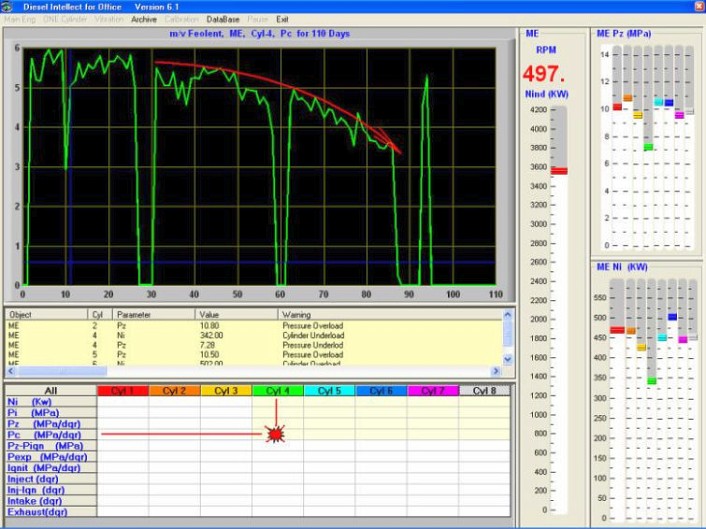
In this particular case, the Compression Pressure continues to fall, which indicates interior cylinder damage.
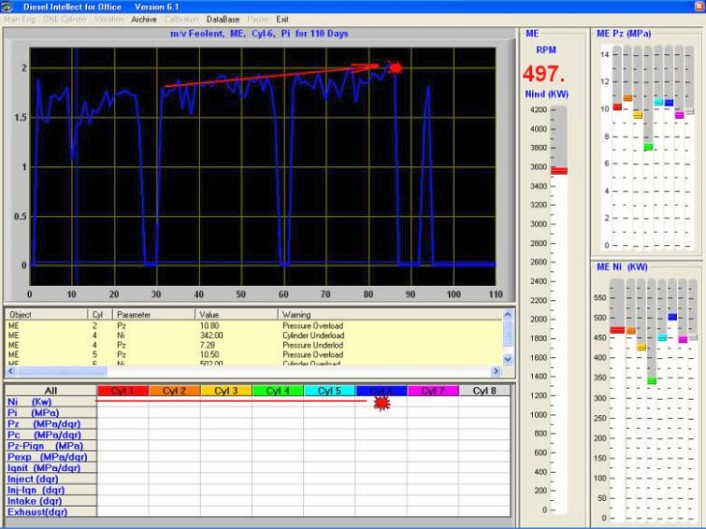
Similarly, analyzing all other cylinders, you can determine which cylinder or cylinders have compensated for cylinder 4’s power loss. In the current example cylinder 6 starts to pick up the power.
By clicking in the Graphic Area, you can get expanded information about the selected period of time.
After clicking on the moment in question, Measurement mode is entered and the Graphic, Warning and Parameter Grid Areas are displayed, as they existed at that point in time.
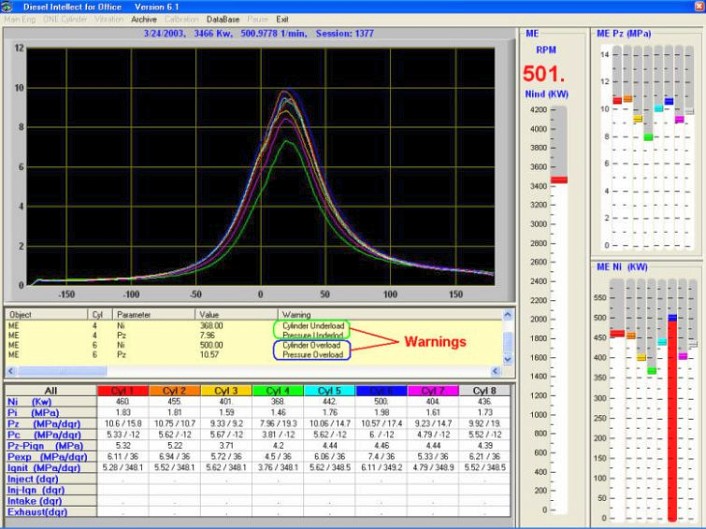
This picture shows that cylinder 4 lost power and cylinder 6 was overloaded. This can be seen in the Cylinder 6 Bar Graph (red) in the Engine Protection Area and by the messages in the Warning Area.
If the analyzer were being used on-board, however, the right section would NOT show the archival data, since the critical function of Main Engine monitoring is never out of sight.
General Information: